A Simple Moving Average is formed by calculating the average
stock price over a certain number of periods.
The Simple Moving Average is one of the most popular
technical analysis tool used by traders. The Simple Moving Average (SMA) is
used mainly to identify the direction of the trend and secondly to recognize
the changes in the trend to help us identify a buy or a sell signal.
To calculate a Simple Moving Average, add all the closing
prices of stocks over a time period and divide them by the number of the time
period.
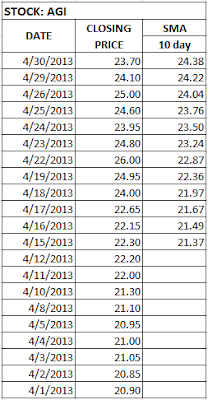
Let’s say the closing price of AGI stocks for the last 10
days were 20.90, 20.85,21.05,21.00,20.95,21.10,21.30,22.00,22.20 and 22.30.
The average would be (20.90+20.85+21.05+21+20.95+21.10+21.30+22+22.20+22.30)/10
= 21.37
 |
| Fig. 1. An Example of a 10-Day SMA |
In Fig. 1 is an example of a 10-day Simple Moving Average of AGI
for the whole month of April starting April 1, 2013.
The first day of the 10 Day Moving Average simply covers the last ten
days of the trade which started on April 15, 2013 based on our example. The second day (April 16) of
the moving average drops the first data point (20.90) and adds the new data
point (22.15).
The third day (April 17) of the moving average continues by
dropping the first data point 20.85 and adding the new data point 22.65.
The
fourth day (April 18) of the moving average drops data point 21.05 and adding the
new data point 24.00.
Continue this computation and plot your graph of Simple Moving
Average using the graph function of your spreadsheet.